Helm workshop: Third party charts
Looking for a chart
Helm works with what is called a “chart”. A chart is basically a package of yaml resources that support a templating language.
Before building our own chart we should always have a look of what is available in the community. There are often charts that fits our needs.
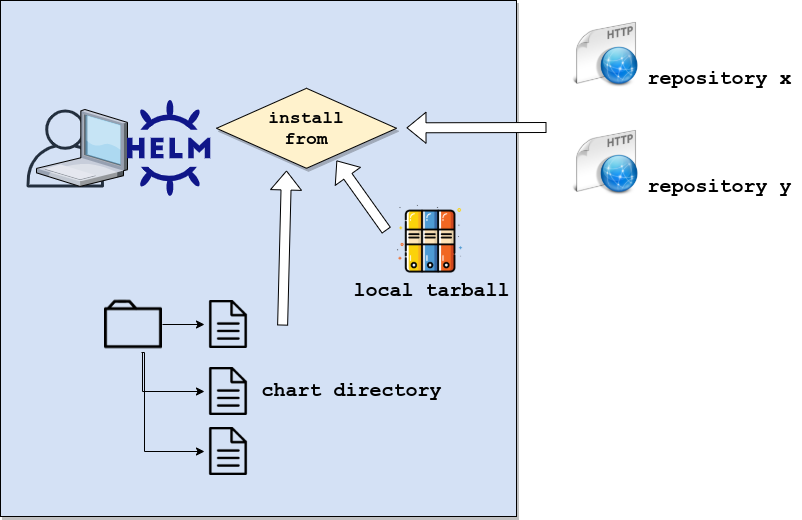
These charts can be installed from different sources: a Helm chart repository, a local archive or chart directory.
First of all, let’s say that we want to install a Wordpress instance on an empty infrastructure.
We’ll need to provision a database as well as the Wordpress application.
Let’s look for a wordpress chart !
If you just installed Helm, your repositories list should be empty
1helm repo list
We’re going to check what are the Wordpress charts available in the artifacthub.
You can either browse from the web page or use the command
1helm search hub wordpress
2URL                                                     CHART VERSION   APP VERSION     DESCRIPTION
3https://artifacthub.io/packages/helm/bitnami/wo...      10.6.4          5.6.1           Web publishing platform for building blogs and ...
4https://artifacthub.io/packages/helm/groundhog2...      0.2.6           5.6.0-apache    A Helm chart for Wordpress on Kubernetes
5https://artifacthub.io/packages/helm/seccurecod...      2.4.0           4.0             Insecure & Outdated Wordpress Instance: Never e...
6https://artifacthub.io/packages/helm/presslabs/...      0.10.5          0.10.5          Presslabs WordPress Operator Helm Chart
Using the Hub there are a few things that can help to choose the best option.
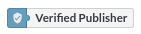
First of all the number of stars obviously and whether the artifact comes from a verified publisher or signed by the maintainer.

We’ll get the one provided by Bitnami. In the chart page you’ll be guided with the commands to add Bitnami’s repository.
1helm repo add bitnami https://charts.bitnami.com/bitnami
2"bitnami" has been added to your repositories
3
4helm repo update
From now on we can install all the charts published by Bitnami:
1helm search repo bitnami
2NAME                                    CHART VERSION   APP VERSION     DESCRIPTION
3bitnami/bitnami-common                  0.0.9           0.0.9           DEPRECATED Chart with custom templates used in ...
4bitnami/airflow                         8.0.3           2.0.1           Apache Airflow is a platform to programmaticall...
5bitnami/apache                          8.2.3           2.4.46          Chart for Apache HTTP Server
6bitnami/aspnet-core                     1.2.3           3.1.9           ASP.NET Core is an open-source framework create...
7bitnami/cassandra                       7.3.2           3.11.10         Apache Cassandra is a free and open-source dist...
Inspect the chart
OK let’s get back to what we want to achieve: Installing a Wordpress instance.
Now that we identified the chart, we’re going to check what it actually does. You should always check what will be installed.
- you can download the chart on your laptop and have a look to its content
 1helm pull --untar bitnami/wordpress
 2
 3tree -L 2  wordpress/
 4wordpress/
 5├── Chart.lock
 6├── charts
 7│   ├── common
 8│   └── mariadb
 9├── Chart.yaml
10├── ci
11│   ├── ct-values.yaml
12│   ├── ingress-wildcard-values.yaml
13│   ├── values-hpa-pdb.yaml
14│   └── values-metrics-and-ingress.yaml
15├── README.md
16├── templates
17│   ├── configmap.yaml
18…
19│   ├── tests
20│   └── tls-secrets.yaml
21├── values.schema.json
22└── values.yaml
- read carefully the readme
- check what are the dependencies pulled by this chart
 1helm show chart bitnami/wordpress
 2annotations:
 3  category: CMS
 4apiVersion: v2
 5appVersion: 5.6.1
 6dependencies:
 7- condition: mariadb.enabled
 8  name: mariadb
 9  repository: https://charts.bitnami.com/bitnami
10  version: 9.x.x
11- name: common
12  repository: https://charts.bitnami.com/bitnami
13  tags:
14  - bitnami-common
15  version: 1.x.x
16...
Note: that the wordpress chart defines the mariadb chart as dependency
- Look at the available values
1helm show values bitnami/wordpress
Our first release
Our next step will be to set our desired values. Indeed you mentioned that Helm uses a templating language to render the manifests. This will help us to configure our instance according to our environment.
- no persistency at all, this is just a workshop
- 2 replicas for the wordpress instance
- a database named “foodb”
- an owner “foobar” for this database
- passwords
All the charts have a file named values.yaml that contains the default values.
These values can be overridden at the command line with --set or we can put them in a yaml file that we’ll use with the -f parameter.
For this exercise we’ll create a file named “override-values.yaml” and we’ll use the command line for sensitive information.
 1wordpressUsername: foobar
 2wordpressPassword: ""
 3wordpressBlogName: Foo's Blog!
 4replicaCount: 2
 5persistence:
 6  enabled: false
 7service:
 8  type: ClusterIP
 9mariadb:
10  auth:
11    rootPassword: ""
12    database: foodb
13    username: foobar
14    password: ""
15  primary:
16    persistence:
17      enabled: false
Note: In order to define the values of a subchart you must put the chart name as the first key. here mariadb.values of the mariadb chart.
Here we go!
First of all we’ll run it in dry-run mode in order to check the yaml rendering (be careful, the passwords are printed in plain text)
1helm install foo-blog bitnami/wordpress \
2-f override-values.yaml \
3--set mariadb.auth.rootPassword=r00tP4ss \
4--set mariadb.auth.password=us3rP4ss \
5--set wordpressPassword=azerty123 \
6--dry-run
Another word you need to know is Release.
“A Release is an instance of a chart running in a Kubernetes cluster”. Our release name here is foo-blog
If the output looks OK we can install our wordpress, just remove the --dry-run parameter
 1helm install foo-blog bitnami/wordpress -f override-values.yaml --set mariadb.auth.rootPassword="r00tP4ss" --set mariadb.auth.password="us3rP4ss" --set wordpressPassword="azerty123"
 2NAME: foo-blog
 3LAST DEPLOYED: Fri Feb 12 16:33:21 2021
 4NAMESPACE: default
 5STATUS: deployed
 6REVISION: 1
 7NOTES:
 8** Please be patient while the chart is being deployed **
 9
10Your WordPress site can be accessed through the following DNS name from within your cluster:
11
12    foo-blog-wordpress.default.svc.cluster.local (port 80)
13
14To access your WordPress site from outside the cluster follow the steps below:
15
161. Get the WordPress URL by running these commands:
17
18  NOTE: It may take a few minutes for the LoadBalancer IP to be available.
19        Watch the status with: 'kubectl get svc --namespace default -w foo-blog-wordpress'
20
21   export SERVICE_IP=$(kubectl get svc --namespace default foo-blog-wordpress --template "{{ range (index .status.loadBalancer.ingress 0) }}{{.}}{{ end }}")
22   echo "WordPress URL: http://$SERVICE_IP/"
23   echo "WordPress Admin URL: http://$SERVICE_IP/admin"
24
252. Open a browser and access WordPress using the obtained URL.
26
273. Login with the following credentials below to see your blog:
28
29  echo Username: foobar
30  echo Password: $(kubectl get secret --namespace default foo-blog-wordpress -o jsonpath="{.data.wordpress-password}" | base64 --decode)
When the release has been successfully installed you’ll get the above “NOTES” that are very useful to get access to your application. You just have to copy/paste.
But first of all we’re going to check that the pods are actually running
1kubectl get deploy,sts
2NAME                                    READY   UP-TO-DATE   AVAILABLE   AGE
3deployment.apps/foo-blog-wordpress   2/2     2            2           55m
4
5NAME                                   READY   AGEkubectl get deploy,sts
6statefulset.apps/foo-blog-mariadb   1/1     55m
We didn’t define an ingress for the purpose of the workshop, therefore we’ll use a port-forward
1kubectl port-forward svc/foo-blog-wordpress 9090:80
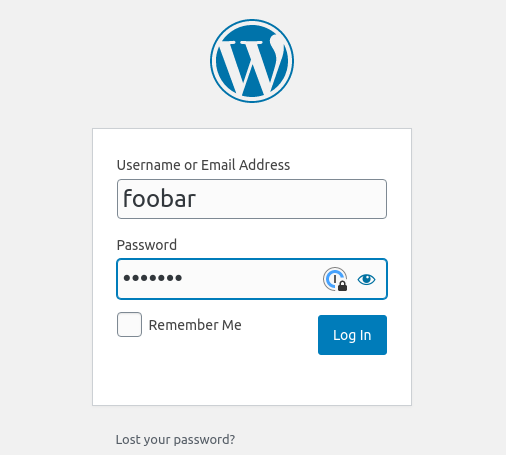
Then open a browser using the URL http://localhost:9090/admin, you’ll be prompted to fill in the credentials you defined above. (wordpressPassword)
We’ll check the database credentials too as follows
1MARIADB=$(kubectl get po -l app.kubernetes.io/name=mariadb -o jsonpath='{.items[0].metadata.name}')
 1kubectl exec -ti ${MARIADB} -- bash -c 'mysql -u foobar -pus3rP4ss'
 2Welcome to the MariaDB monitor.  Commands end with ; or \g.
 3Your MariaDB connection id is 372
 4Server version: 10.5.8-MariaDB Source distribution
 5
 6Copyright (c) 2000, 2018, Oracle, MariaDB Corporation Ab and others.
 7
 8Type 'help;' or '\h' for help. Type '\c' to clear the current input statement.
 9
10MariaDB [(none)]> SHOW GRANTS;
11+-------------------------------------------------------------------------------------------------------+
12| Grants for foobar@%                                                                                   |
13+-------------------------------------------------------------------------------------------------------+
14| GRANT USAGE ON *.* TO `foobar`@`%` IDENTIFIED BY PASSWORD '*CD5BE357349BDA710A444B0BD741E8EB12B8BC2C' |
15| GRANT ALL PRIVILEGES ON `foodb`.* TO `foobar`@`%`                                                    |
16+-------------------------------------------------------------------------------------------------------+
172 rows in set (0.000 sec)
Delete the wordpress release
1helm uninstall foo-blog
Deploy a complete monitoring stack with a single command!
The purpose of this step is to show that, even if the stack is composed of dozens of manifest, Helm makes things easy.
1helm repo add prometheus-community https://prometheus-community.github.io/helm-charts
2"prometheus-community" has been added to your repositories
3
4helm repo update
1helm install kube-prometheus prometheus-community/kube-prometheus-stack --create-namespace --namespace monitoring
2NAME: kube-prometheus
3LAST DEPLOYED: Fri Feb 12 18:03:05 2021
4NAMESPACE: monitoring
5STATUS: deployed
6REVISION: 1
7NOTES:
8kube-prometheus-stack has been installed. Check its status by running:
9  kubectl --namespace monitoring get pods -l "release=kube-prometheus"
Check that all the pods are running and run a port-forward
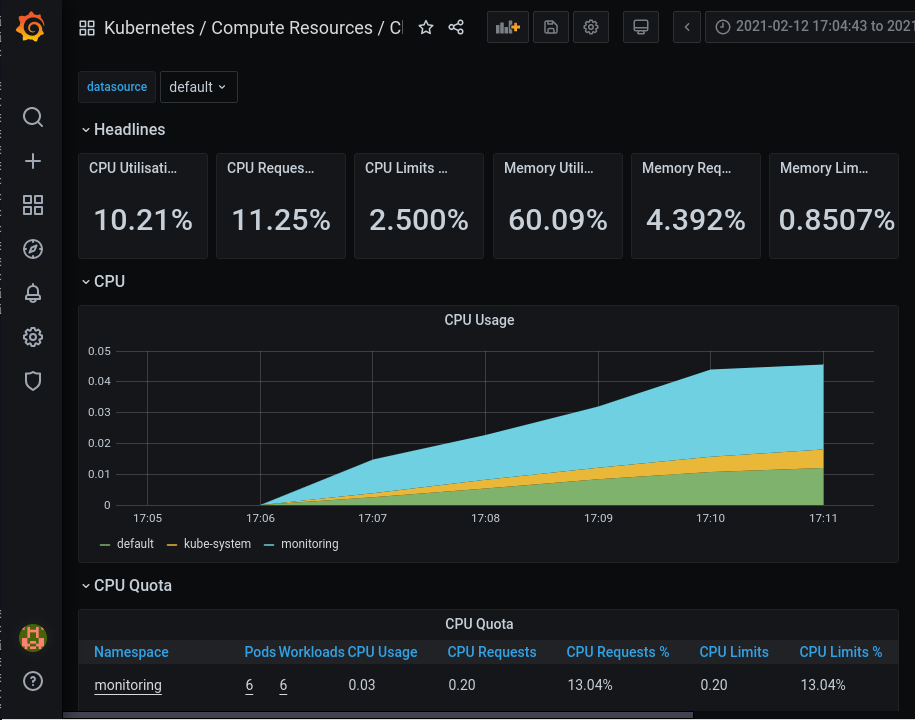
1kubectl port-forward -n monitoring svc/kube-prometheus-grafana 9090:80
Then open a browser using the URL http://localhost:9090/admin
default credentials: admin / prom-operator
You should browse a few minutes over all the dashboards available. There is pretty useful info.
You can then have a look to the resources that have been applied with a single command line as follows
1helm get manifest -n monitoring kube-prometheus
Well for a production ready prometheus we would have played a bit with the values but you get the point.
Delete the kube-prometheus stack
1helm uninstall -n monitoring kube-prometheus